• Measurement and graphical display of CO₂ levels in exhaled air.
• Main parameter: ETCO₂ (End-Tidal CO₂), the amount of CO₂ present in the exhaled air at the end of expiration.
• Normal ETCO₂ Range: 35–45 mmHg
• Used in: ICU, ER, Operation theatre, during CPR, sedation, mechanical ventilation.
• Type: Non-invasive, continuous
One graph of capnography = One respiratory cycle

A normal capnography waveform consists of four phases:
Phases | Description | |
Expiratory | Phase I (Baseline) | Exhalation of dead space air (CO₂ = 0) |
Expiratory | Phase II (Expiratory Upstroke) | Mixing of dead space and alveolar gas |
b/w Phase II & Phase III | Alpha angle | |
Expiratory | Phase III (Alveolar Plateau) (PYQ: NEET PG 2024) | – Alveolar gas exhalation (Alveolar ventilation) – EtCO₂ is measured at the end of this phase |
b/w Phase III & Phase IV | Beta angle – At this point EtCO₂ is measured | |
Inspiratory | Phase IV / Phase 0 (Inspiratory Downstroke) | – Inhalation – CO₂ drops to zero |
Capnography | Seen in |
Above the baseline | • When we use Exhausted soda lime • Faulty expiratory valve |
Step ladder pattern | Malignant hyperthermia |
Falling wedge pattern (sudden fall in EtCO₂ during Sx) Sx- Posterior fossa craniotomy | Venous air embolism- • When surgical site is above the heart level Signs of venous air embolism- • Sudden EtCO₂ decrease • Sudden BP decrease • Wind mill wheel murmur • Initial PR increase then decrease • Cardiac arrest |
Curare notch | It indicates return of spontaneous ventilation Next step We give top up notch of muscle relaxant |
Flat capnography | • Seen in esophageal intubation • ET tube in trachea but still flat capnography- – Circuit is disconnected – Complete bronchospasm – Cardiac arrest |
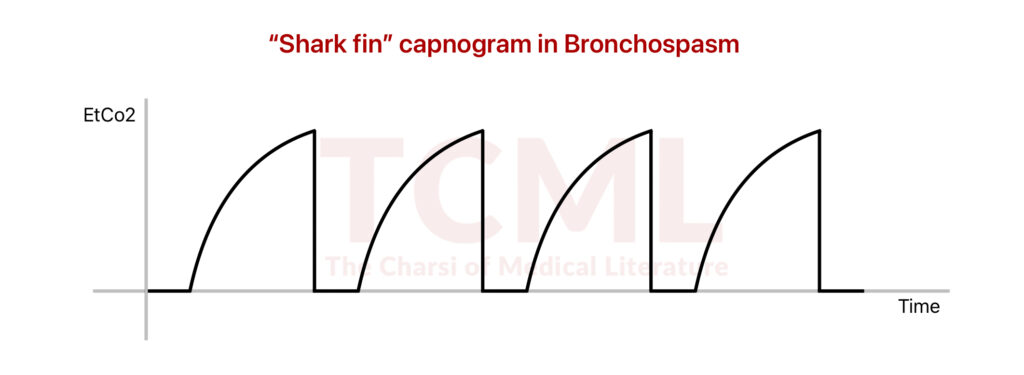
Shark fin pattern | Seen in bronchospasm- • Asthma • COPD |
Hyperventilation capnography | Heights is reduced due to excessive CO2 washout |
Hypoventilation capnography | Due to excess CO2 |
